Cette version peut contenir des modifications incorrectes. Passez au dernier aperçu vérifié.
Ce dont vous avez besoin
-
Cette étape n’est pas traduite. Aidez à la traduire
-
To cancel the graphing process, press the "ON" button.
-
-
Cette étape n’est pas traduite. Aidez à la traduire
-
Go to "Zoom." Navigate to and highlight "ZoomFit" then press "Enter." Doing so will automatically set your graphing window to the most appropriate dimensions.
-
-
-
Cette étape n’est pas traduite. Aidez à la traduire
-
If you are graphing complex equations, multiple equations, or a combination of the two, it may take anywhere from 1 minute to 5 minutes to graph.
-
-
Cette étape n’est pas traduite. Aidez à la traduire
-
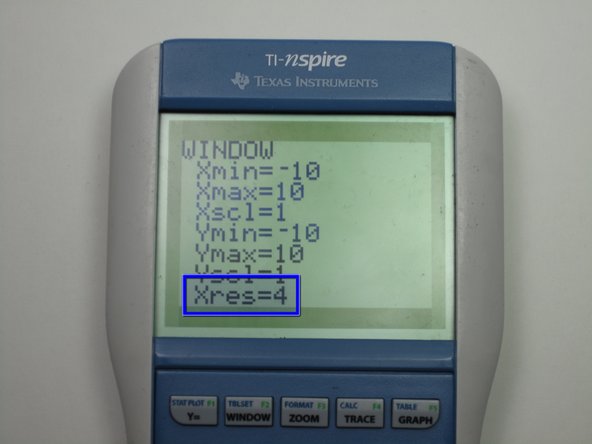
If you feel that your graph is taking too long, you can change the step resolution to a bigger number. To do so, press "Window" and change "Xres" to a value between 1 and 8. A bigger Xres value will graph more quickly.
-


